
How to Access Textual Analysis
To view the insights generated by Textual Analysis in your surveys, follow the steps below:
-
Access the Listen Section: In the side menu, navigate to the "Listen" section.
-
Select Textual Analysis: Within "Listen," click on "Textual Analysis."
-
Select Data Source: In the "Data source" filter, you can select between "Reviews" or "Surveys" to analyze feedback from different sources.
Attention: To use Text Analysis in Campaigns, enable the feature first
Follow: Enable Text Analysis in Campaigns
Detailed Charts and Visualizations
-
Net Sentiment Score (NSS): Harmo metric calculated by AI from the text of reviews/survey responses. It ranges from –100 to 100 and indicates the predominant sentiment of topics in the text categorized by the AI (the higher, the more positive).
-
How to read: the Positive/Neutral/Negative counts represent classified topics, not the number of reviews/survey responses.
-
Example: a review stating “excellent service” and “defective product” produces 1 positive topic (service) and 1 negative(product).
-
-
Net Sentiment Score (Insights): Here, Harmo's AI automatically identifies and groups the most recurring themes in open-ended responses. Topics such as "Service," "Experience," "Price," "Product," "Location," and "Store Environment" are highlighted, allowing you to quickly see what matters most to your customers and which aspects are most frequently mentioned. Additionally, you can view the most cited units/stores for each topic.
-
Feedback: This section highlights the most relevant topics mentioned by customers, categorized by sentiment. You can quickly identify which aspects of your business are generating the most positive or negative comments. For example, topics like "Service," "Experience," "Price," and "Store Environment" are frequently analyzed.
-
Topic Recurrence: The chart shows how frequently certain themes appear in comments, as well as the variation of this recurrence over time. It helps you identify if a topic's mentions are Decreasing or Increasing, allowing you to track the evolution of customer perception on specific points.
-
Sentiment Change: This chart illustrates how the sentiment towards specific topics is changing over time. You can see if the average sentiment for a topic is becoming more positive or negative, which is crucial for evaluating the impact of corrective actions or implemented improvements.
-
Topic Evolution: The Topic Evolution chart offers a detailed temporal view of a selected topic, showing the distribution of sentiments (Positive, Neutral, Negative) month by month. This allows you to identify peaks of satisfaction or dissatisfaction and correlate them with specific events or actions of your company.
Action Plan: Harmo's Differentiator
One of Harmo's great differentiators in Textual Analysis is the ability to generate an Action Plan based on the insights obtained. This functionality transforms analyzed data into practical and strategic recommendations, allowing you to:
-
Prioritize Improvements: Identify areas that require immediate attention based on sentiment and topic frequency.
- Make Strategic Decisions: Use recommendations to improve products, services, and customer experience.
- Monitor Progress: Track the effectiveness of implemented actions and adjust your strategy as needed.
How to Activate Textual Analysis in your Surveys
To take advantage of Textual Analysis, you need to activate it in specific questions within your surveys, such as NPS questions. Follow the steps below:
-
Access the Surveys: Navigate to the desired surveys where you have open-ended questions.
-
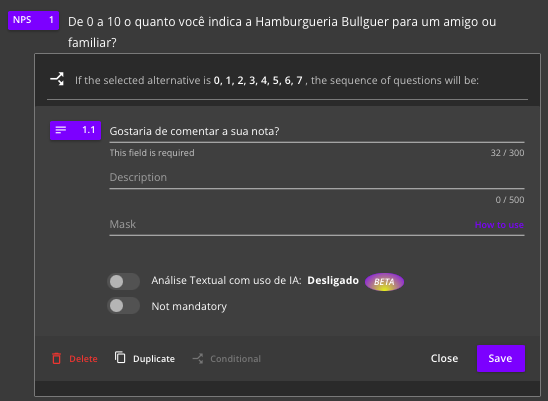
Edit the Question: Click on the open-ended question (for example, an NPS question that asks for a comment) to edit it.
Activate Textual Analysis: Within the question options, locate the "Textual Analysis with AI" section and activate the option, as illustrated in the image below.
-
Save Changes: Make sure to save the changes to the question and the surveys.
By activating this feature, the textual responses collected for this specific question will be processed by artificial intelligence, providing detailed reports and valuable insights for your analysis.